
The advanced targeting options in Facebook can offer a wealth of insight into your campaign’s target audience when analysing a campaign.
The real benefit of Facebook targeting is that members create profiles containing their age & sex so targeting is relatively accurate. As it’s a logged-in environment, these demographics can be served targeted ads/messaging with some accuracy every time someone logs into Facebook.
The Key to Targeting
So we know that Facebook members can be segmented and targeted demographically, but ad serving is only the beginning of how this data can be used.
To get additional insight into your audience, it’s possible to analyse Facebook engagement data to show your most active segments. It is also very easy to present this in a meaningful & simple way using Excel pivot tables.
The first thing to consider with a general targeted campaign is that ads targets should be split by gender, then by age, then by device and finally by whether they are fans or not fans of your brand on Facebook already. Going on traditional gender/age demographic spits we should have 10 targets to begin, ie. men & women aged 18-24, 25-34, 35-44, 45-54, 55+.
At this point, we can add a device split by separating mobile & desktop devices. This is very important given that Facebook is accessed on mobile devices more than desktops, as a result targets will behave differently. Moreover this can have an impact on conversion, ie. if mobile is driving most traffic, a mobile-optimised website/conversion process will be key to driving success and revenue/leads. Another possible split (though not essential as it is more to do with ad formats than audience targeting) would be to target desktop right-hand column ads and newsfeed ads differently – this is not an issue for mobile as mobile only supports newsfeed ads.
Following this segmentation, targeting Facebook fans & non-fans allows us to see if the existing fanbase was more or less receptive to the messaging than non-fans.
Each ad should be named after the targeting type for easy analysis on completion of the campaign, eg. “Men 18-24 Fans Mobile – Post 1” or “Women 35-44 Not Fans Desktop Post 9” etc.
Steps to Aggregating your Report Data
- When you download the campaign you only need a few columns (all relative metrics, CTR, CPC, Cost per Like, Competition Entry Rate etc. can be worked out using Excel formulas).
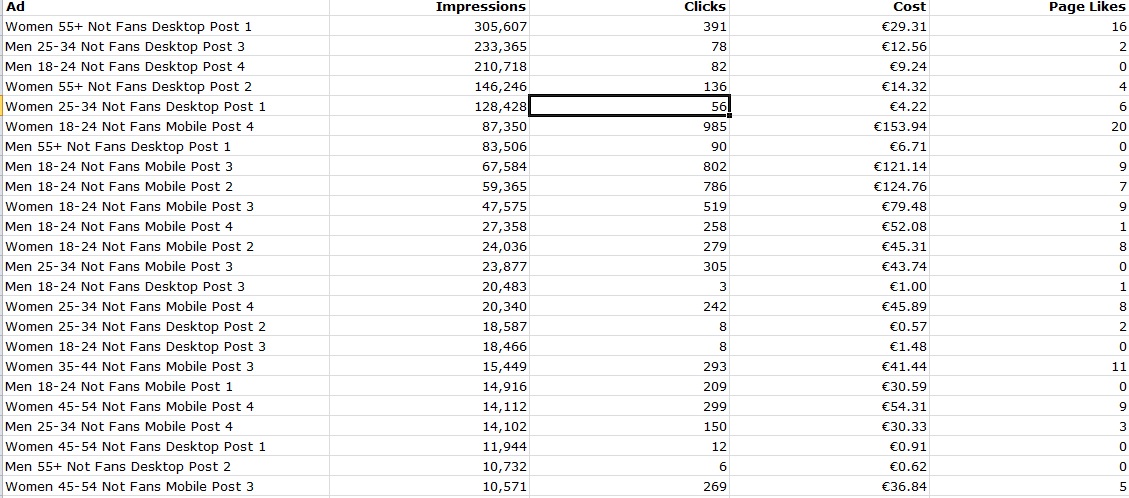
- The first step is to add some columns to build out your data for the pivot table/chart.
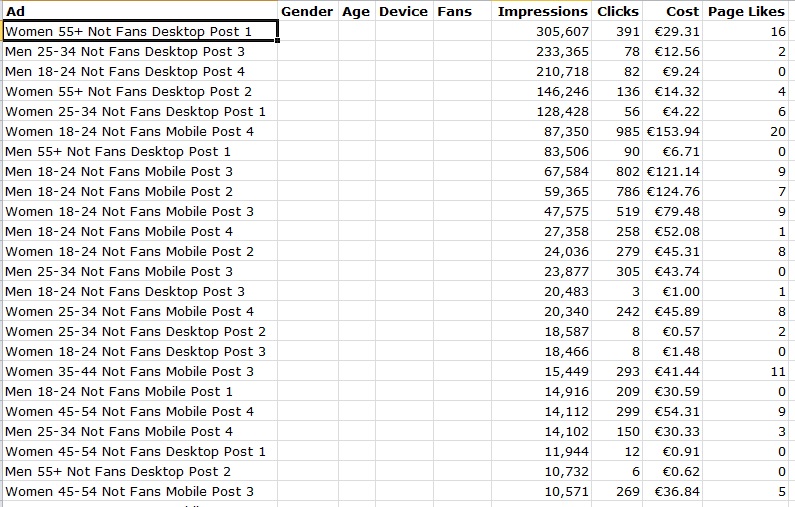 Using filters in Excel (CTRL+L) you can populate these extra columns with the appropriate data.
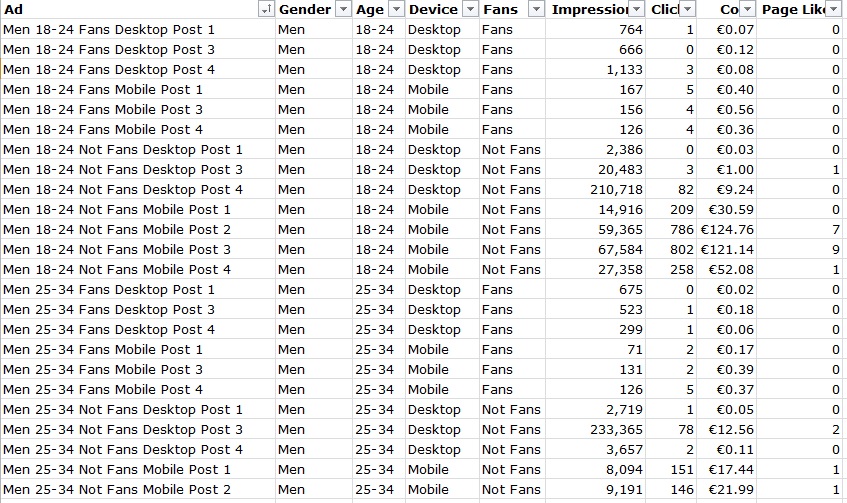
- Once the data sheet is completed, highlight all of the data and insert a pivot table/chart.
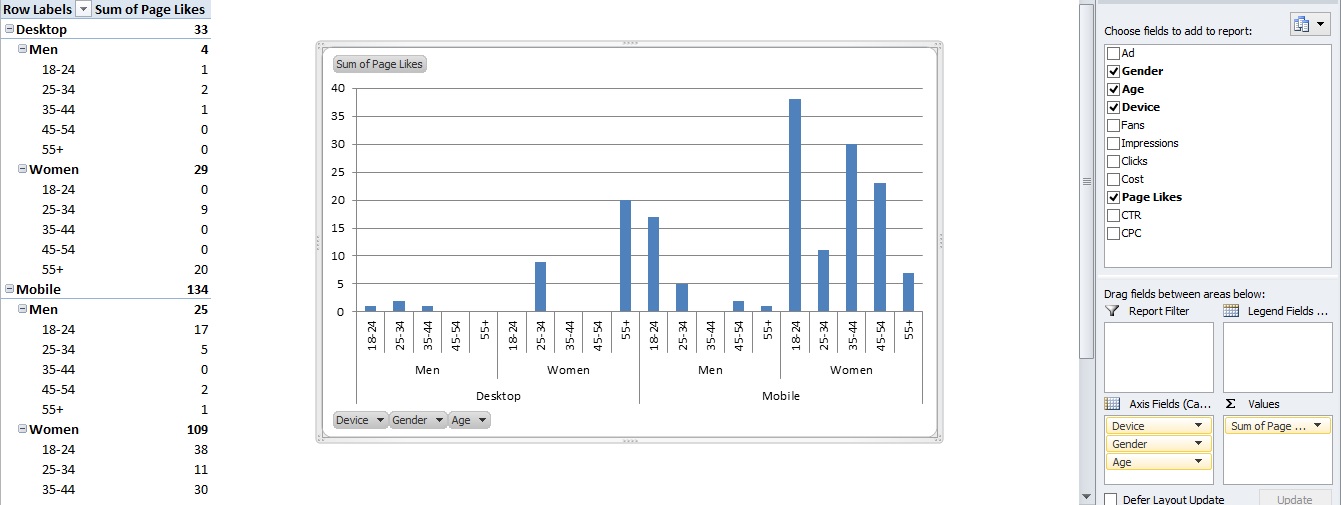
- Choose the metrics you’re most interested in when putting your pivot table/chart together. Use pivot table calculated fields to create the relative metrics, CPC, CTR, cost per like etc.
Summary
As pivot charts aggregate all of the data into categories, it is possible to see whether men or women liked your page, on what device and what their ages are.
It is also a good idea to pull different combinations of the targeting into the axis fields and change the metrics in the values fields to see if anything strange or interesting emerges.
Facebook offers excellent insight into audience engagement with brands on social media when data is aggregated using pivot tables.
By default, target your Facebook campaigns by age, device, gender and fans/non-fans. Name your ads after the targeting type. The real benefit of this set up is that you can analyse, in aggregated detail, using Excel pivot tables, how each segment performed. This can then inform decisions about future social strategies, set KPIs and target more effectively.
Secondly, though not wholly reliable, given that the data isn’t robust enough when compared to major research houses, these report outputs provide some audience insight. The caveat is that it is only insight into the Facebook audience which isn’t representative of an entire target audience.